Managed monitoring

Infrastructure monitoring with Grafana and AI-powered dashboards

Monitor the availability, performance, and traffic of your network in real time. Create custom dashboards with AI and receive alerts before your users notice a problem.

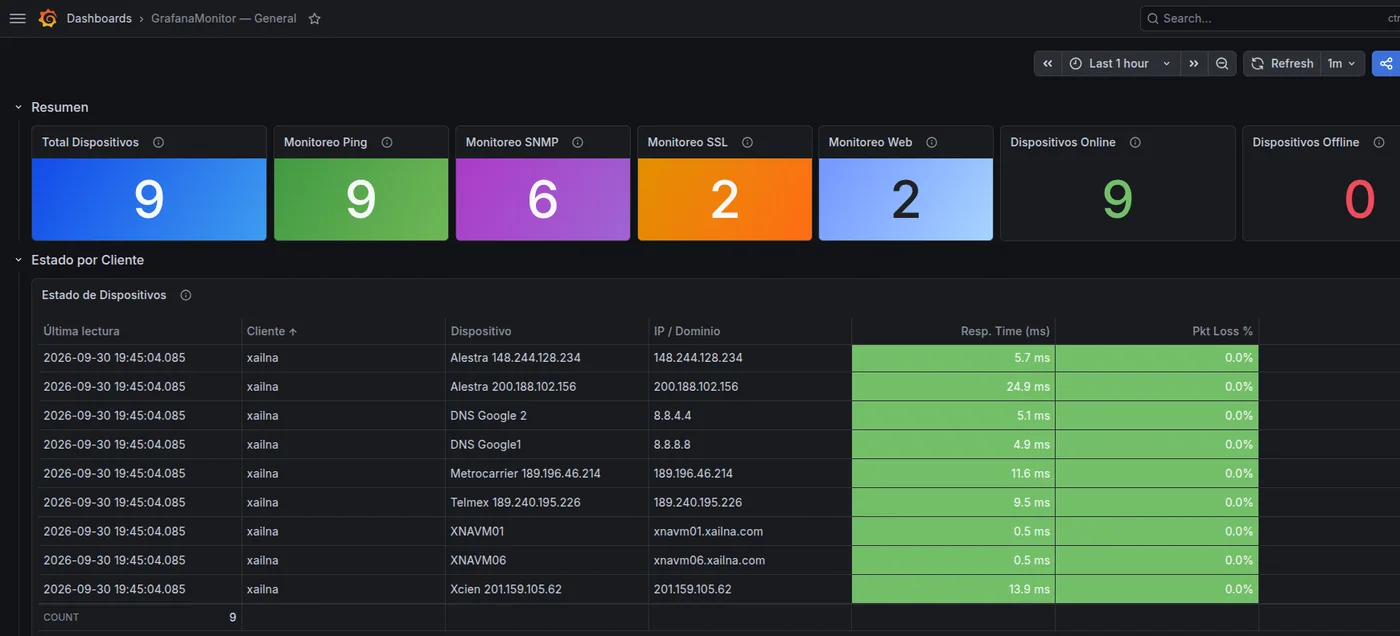
GrafanaMonitor dashboard showing the device summary and per-customer status

Why choose us?

Professional monitoring without complexity

A fully managed service: we configure, maintain, and update the platform. You just visualize and decide.

100% cloud-based

No monitoring servers to install. Your Grafana platform runs with high availability from our datacenter.

AI-powered dashboards

Create custom dashboards by describing what you need in plain language. AI builds them for you.

Technical support included

Support via email and WhatsApp. We help you with configuration, alerts, and dashboard optimization.

Predictable pricing

Annual subscription with everything included. No hidden costs, no additional licenses, no surprises.

How it works

From zero to full monitoring in 3 steps

We take care of all the infrastructure. You just add your devices and start visualizing.

1

Register your devices

From the web portal, add your switches, routers, firewalls, and servers. Bulk import with a CSV file.

2

Automatic collection

Telegraf collects metrics from each device via SNMP and Ping. Data is securely stored in InfluxDB.

3

Visualize and act

Access your Grafana dashboards with real-time metrics. Create dashboards with AI and receive instant alerts.

Monitoring capabilities

Full visibility of your infrastructure

Three monitoring pillars covering availability, performance, and traffic for every device on your network.

Availability (Ping)

Continuous availability and latency monitoring for every device with ping tests every 60 seconds.

  • Average, minimum, and maximum latency
  • Packet loss
  • Availability percentage (uptime)
  • Automatic outage detection
  • Exportable SLA reports

Performance (SNMP)

Detailed CPU, storage, and system metrics via SNMP protocol v1, v2c, and v3.

  • Real-time CPU load
  • Storage usage by volume
  • Operating system uptime
  • Equipment description and version
  • Compatible with 3,000+ device types

Network interfaces

Full visibility into traffic, errors, and operational status of every interface on your network devices.

  • Inbound and outbound traffic (bps)
  • Errors and discards per interface
  • Operational and admin status
  • Speed and physical address
  • Individual interface filtering

Artificial intelligence

Dashboards created with natural language

Describe what you need to see and AI builds the Grafana dashboard automatically, using the real data from your infrastructure.

Tell the AI what you need

You don't need to be a Grafana or InfluxQL expert. Write an instruction like "Show me the latency of my devices in Mexico City grouped by branch" and AI will generate a functional dashboard with your real data.

Natural language Describe your dashboard as you would explain it to a colleague
Smart panels Charts, tables, stats, and gauges generated automatically
Real data Every dashboard uses your actual device inventory and metrics
Reusable Save the prompt and reuse it to create variants or improve it
YOUR PROMPT "Show me average latency by branch over the last 24 hours as a bar chart" AVERAGE LATENCY BY BRANCH — 24H 2.1ms NYC 3.4ms MIA 4.7ms DAL 1.1ms LAX 6.2ms CHI ✦ AI

Plans and pricing

Choose the plan that fits your infrastructure

All plans include an annual subscription with full platform access, built-in dashboards, and technical support.

Starter

For small and medium networks

50 devices
2 AI dashboards
Ping + SNMP monitoring
4 built-in dashboards
Email alerts
Web management portal
SLA reports
Email technical support
Request a quote

Enterprise

For large-scale infrastructure

500 devices
50 AI dashboards
Everything in Professional
Unlimited users
Remote Telegraf configuration
Personalized onboarding
Guaranteed support SLA
Quarterly metrics review
Request a quote

All plans are annual subscriptions. Need more devices or a custom plan? Contact us.

Monitor your network with the same stack the big players use: Grafana, InfluxDB, and Telegraf — without the complexity of running it yourself.

Included in all plans

Everything you need from day one

No hidden costs. Every plan comes ready to use with everything included.

Device management web portal
4 built-in Grafana dashboards
Email alerts and notifications
Dedicated Grafana access per client
Initial setup and configuration
Technical support
Availability and SLA reports
CSV device import
Updates and maintenance included

Start monitoring your infrastructure today

Request a free demo and discover how Grafana, InfluxDB, and AI dashboards can give you full network visibility from day one.

Request a demo