Infrastructure monitoring

PRTG Network Monitor: full visibility of your network in real time

Monitor servers, switches, routers, firewalls, and critical applications. Detect failures before they impact your users with intelligent alerts and intuitive dashboards.

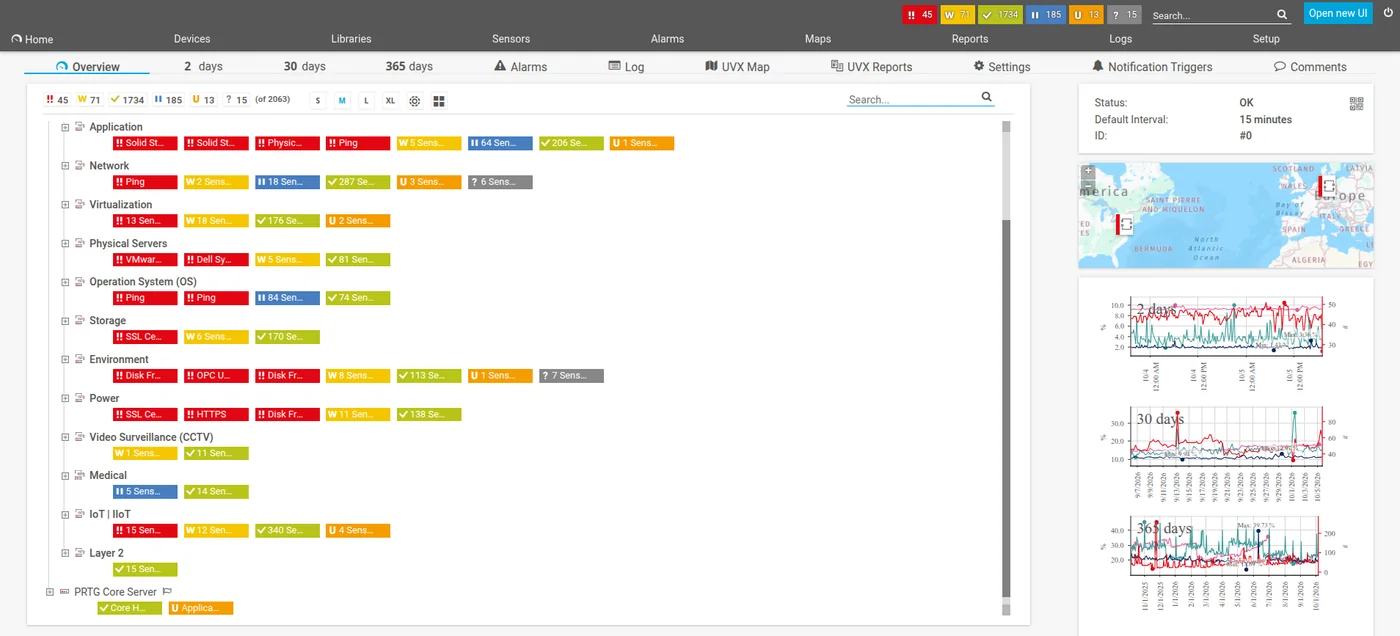
PRTG Network Monitor console showing the device tree by category and a 2,063-sensor summary

Why PRTG?

Advantages of monitoring with PRTG Network Monitor

A complete platform to monitor your entire IT infrastructure, available in the cloud or in your own datacenter.

Cloud in a Mexican datacenter

PRTG Cloud operates with high availability from Mexico. No server management, no additional licenses.

Third-party integration

Compatible with XpoLog, Grafana, and complete observability ecosystems. Frictionless connectivity.

24/7 Spanish-language support

Technical support included 24/7. By phone, email, and WhatsApp from Mexico.

Flexible pricing in MXN

Pay-per-use in blocks of 500 sensors. Monthly or annual billing, no long-term contracts.

Core functionalities

Comprehensive infrastructure monitoring

From the network to the cloud, PRTG monitors every critical component of your technology operations.

Network monitoring

Complete monitoring of traffic and performance across your network infrastructure.

  • Traffic and bandwidth usage
  • Latency and packet loss
  • NetFlow, xFlow, and jFlow analysis
  • Traffic composition by protocol
  • Link utilization and response times
Equipment monitoring

Monitoring of Windows and Linux servers, multi-vendor firewalls, and network devices.

  • Windows and Linux servers
  • SNMP and WMI monitoring
  • Multi-vendor firewalls
  • Switches and routers
  • 3,000+ device types

Web monitoring

HTTP/HTTPS availability checks, user flow simulation, and performance testing.

  • HTTP/HTTPS availability
  • Functional and load testing
  • Stress testing
  • 24/7 synthetic user
  • Testing from Mexico and globally

The console in use

This is your network inside PRTG

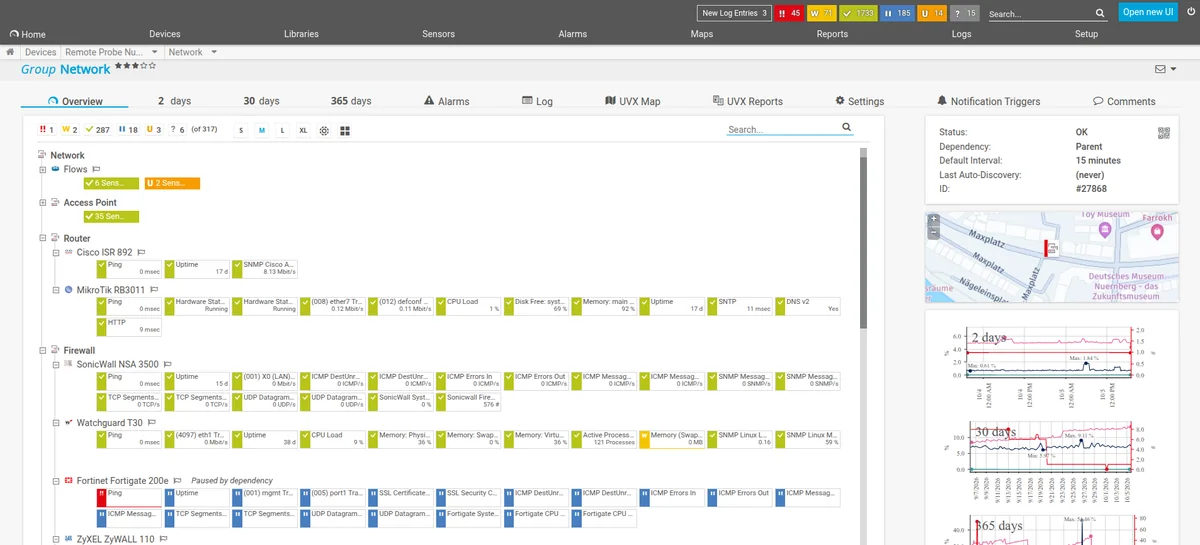
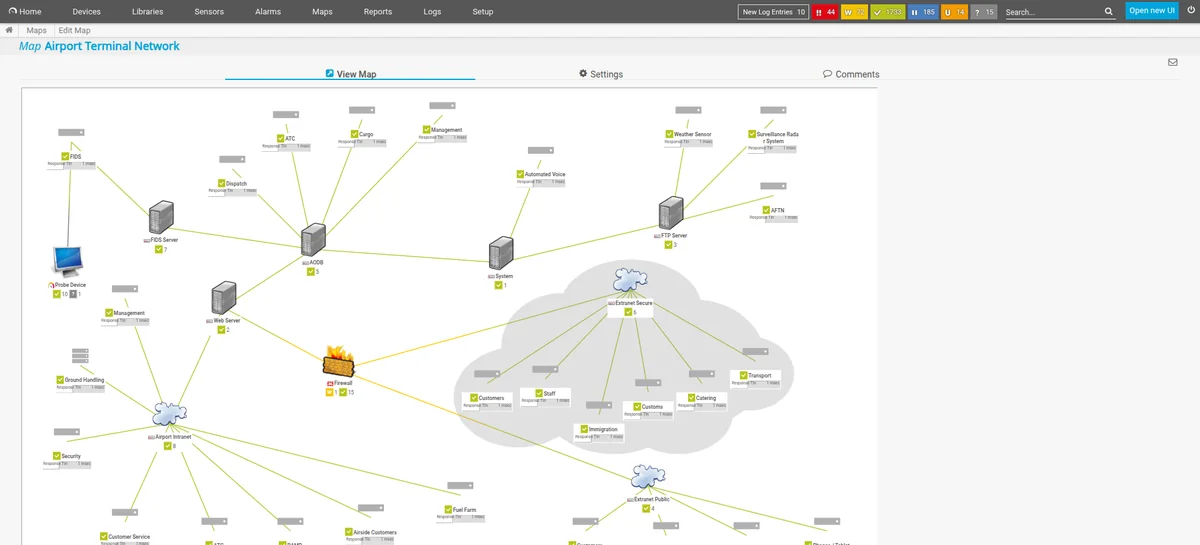
Two real views of the platform: the per-group detail with every sensor in its current state, and the topology maps drawn from the devices you already have registered.

PRTG network group showing routers and Fortinet, SonicWall, Watchguard and ZyXEL firewalls with their individual sensors
Device tree

Every sensor, its value and its state

Drill from group to device and from device to sensor: ping, uptime, CPU load, memory, per-port traffic, certificate validity and ICMP errors. In this capture, a Fortigate 200e, a SonicWall NSA 3500, a Watchguard T30 and a ZyXEL ZyWALL all living in the same tree.

PRTG topology map showing an airport terminal network with servers, firewall, extranet clouds and live response times
Topology maps

The network drawn, with live data

Maps are built from the devices already being monitored and show their state and response time right on the diagram. Useful to explain the architecture to someone who does not know it, and to pinpoint which leg the problem is on.

Cloud services

Integrated Azure and AWS monitoring

Automatically discover and monitor your resources across the leading public cloud platforms.

Microsoft Azure

Automatic discovery of 20+ Azure resource types via REST API. Complete monitoring of your Microsoft cloud environment.

SQL Database Virtual Machines Storage Accounts WebSites Redis DataFactory Service Bus ServerFarms

Amazon AWS

Monitoring of EC2 instances, EBS storage, RDS databases, Lambda functions, and Route 53 health, including costs.

EC2 EBS RDS Lambda Route 53 Costs CPU/Network

Multi-vendor compatibility

Firewalls supported by PRTG

Monitor firewalls from leading manufacturers with multiple monitoring methods.

FirewallMonitoring methods
Cisco ASANative sensor, SNMP, Syslog, NetFlow
FortiGateDevice template, SNMP, Syslog, NetFlow
Palo Alto NetworksDevice template, Syslog, NetFlow
SonicWallNative sensor, SNMP, Syslog, NetFlow
Sophos UTMDevice template, Syslog, NetFlow
CheckpointDevice template, SNMP, Syslog, NetFlow
MikrotikDevice templates, SNMP, Syslog, NetFlow
JuniperNative sensor, SNMP, Syslog, NetFlow
pfSenseSNMP, Syslog, NetFlow
WatchGuard FireboxSNMP, Syslog, NetFlow
Barracuda CloudGenSNMP, Syslog, NetFlow
DraytekSNMP, Syslog, NetFlow
ZyXELSNMP, Syslog, NetFlow

Availability and SLA

Measure and report your service level

Ping-based availability monitoring to meet and demonstrate your service level agreements.

99.9%
Target uptime
<5ms
Average latency
0%
Packet loss
24/7
Continuous monitoring

Automated availability reports

PRTG continuously measures the availability of each device and generates detailed SLA reports that you can share with your clients or internal teams.

  • Ping measurement with 5 packets per minute
  • Packet loss tracking
  • Maximum, minimum, and average response times
  • Uptime/downtime percentage calculation
  • Configurable and exportable SLA reports
Add-on service

AI-powered NOC

Your PRTG data, presented the way a NOC needs it

PRTG already collects everything you need. The gap is usually elsewhere: the console is built for configuring sensors, not for an operator to read platform status at a glance from a screen five metres away. That's what we solve.

STEP 1

Describe what you need to see

"I want the health of my servers with CPU, RAM, and disk, laid out for the NOC screen." In plain language — no templates, no coding.

STEP 2

AI builds the board

It takes the sensors you already have in PRTG, picks the relevant metrics, and assembles the view. It offers several styles so you can choose the one that fits your operation.

STEP 3

It goes live

The dashboard feeds straight from PRTG and refreshes on its own. Put it on the NOC video wall or share it with management.

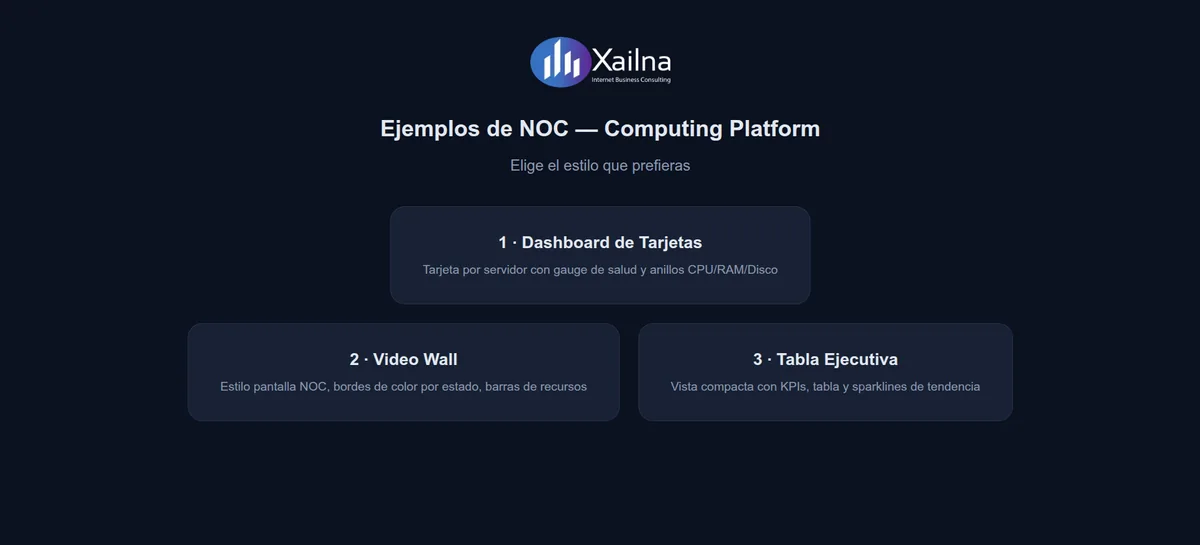
Style selector for AI-generated NOC dashboards built from PRTG data
Pick the format

One dataset, whichever format serves you

AI doesn't force a single view. It proposes several formats over the same set of sensors and you pick what fits: cards for the shift on duty, video wall for the big screen, or an executive table for the management report.

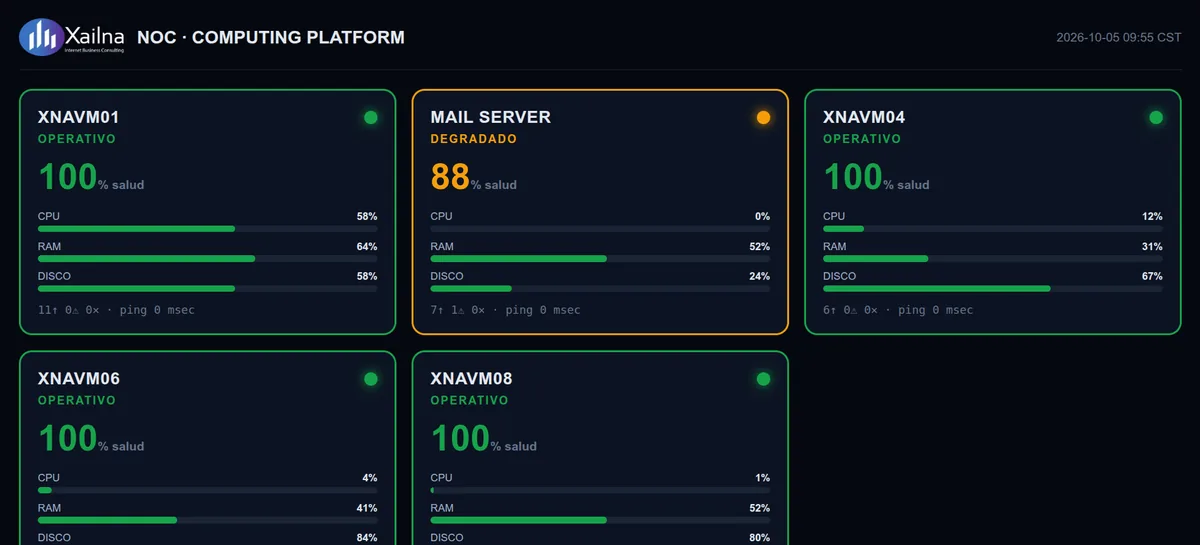
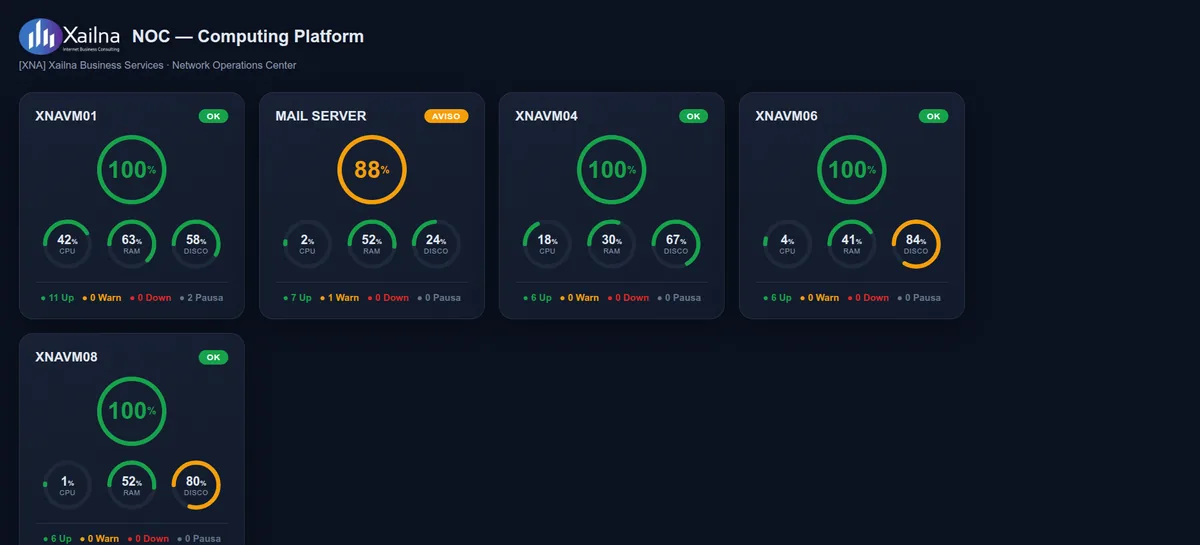
Card dashboard with one card per server, health gauge, and CPU, RAM, and disk rings
Card dashboard

One card per box, health at the centre

Each server with its consolidated health percentage and CPU, RAM, and disk rings around it. Below, the count of sensors up, warning, down, and paused. The operator on duty spots the degraded box without opening a single menu.

Video wall view with status-coloured borders and resource usage bars per server
Video Wall

Built for the NOC screen

Border colours by state — operational, degraded, down — and usage bars you can read from across the room. This is the view that stays projected all shift: if something changes colour, you see it from the far side of the floor.

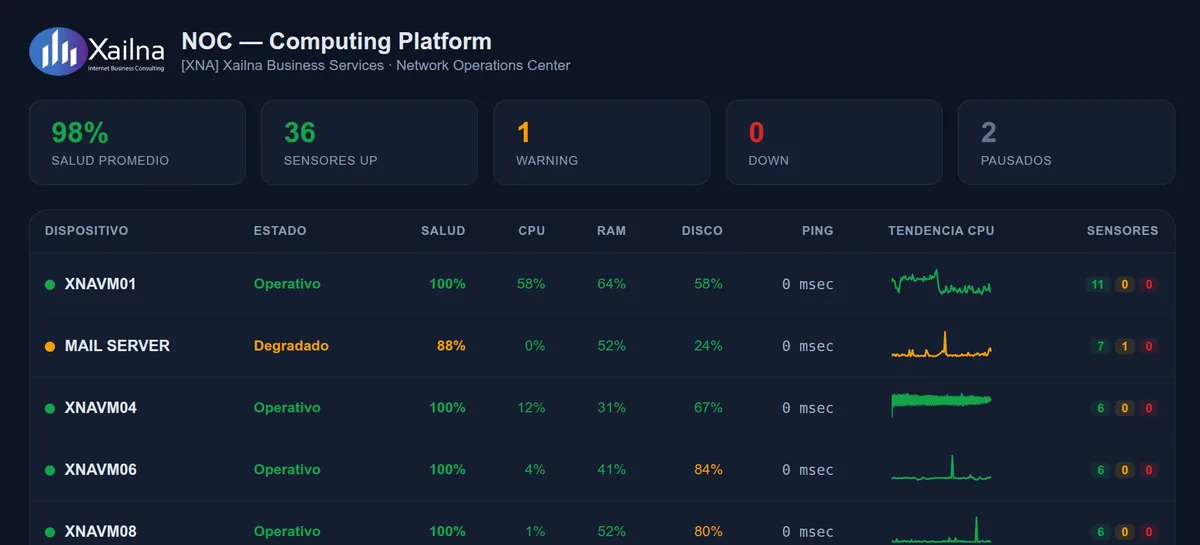
Executive table with average health KPIs, sensors up, warnings and down, plus CPU trend sparklines
Executive table

KPIs and trend for the report

Average health, sensors up, warnings, and down across the top row; below, per-device detail with CPU trend sparklines. The view you send upstairs when someone asks how the platform is doing.

AI-generated NOC dashboards are an add-on service, separate from the PRTG license. It is contracted on its own and can be added at any point, whether your platform runs on-premise or on PRTG Cloud.

With PRTG you know what's happening in your network before your users call you.

PRTG Cloud includes

Everything you need to start monitoring

No hidden costs. PRTG Cloud comes ready to use with everything included from day one.

Unlimited access to monitoring console
iPhone and Android mobile apps
Unlimited email alert delivery
24/7 support included
Automatic updates
Billing in Mexican pesos
Migration from PRTG on-premise
Installation and initial configuration
Training and knowledge transfer

Discover PRTG Cloud today

Schedule a free demo and discover how PRTG can give you complete visibility of your infrastructure from day one.

Request a demo